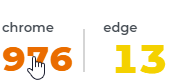
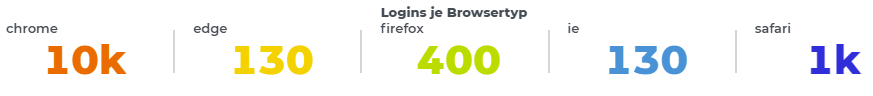
A chart type which displays the individual value series in tabular form as numerical values.
Display example
Several series are displayed accordingly below or next to each other. This depends on the axis assignment (setting: Switch axis).
Special setting options
Settings name | Effect | Example |
|---|---|---|
Chart display | ||
Short notation for large numbers | Abbreviates numbers by increments of a thousand. So '1000' becomes '1k', '1000000' becomes '1M','1000000000' becomes '1billion', etc. Numbers after the decimal point are determined by the 'precision' of the corresponding dashboard attribute. The dashboard attributes can be managed in the Dashboard configuration. (Double-click on the field in the value list or directly via its child elements in the element tree). The abbreviation texts can be customized in localization via the bundle 'common' and the keys 'numShort.XXX'. |
|
Hide units | Hides the units of measured values. For example, '10.5 kg' becomes '10.5'. (Only for values with units; type: UnitNumber) | |
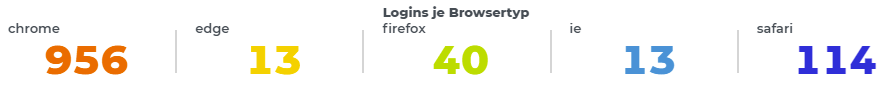
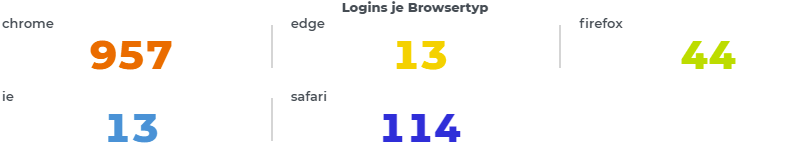
Number of elements | Specifies how many tiles are displayed in one row. The space is distributed equally accordingly. The font size of the individual tiles is rescaled accordingly. (So 100% of the width divided by the set number gives the width of a tile). If this option is less than or equal to 0 or empty, all tiles are written to one line and the distribution is: 100% of the available width divided by the number of tiles, gives the width of one tile. |
With 'Number of elements' = 3 |
Processing input data
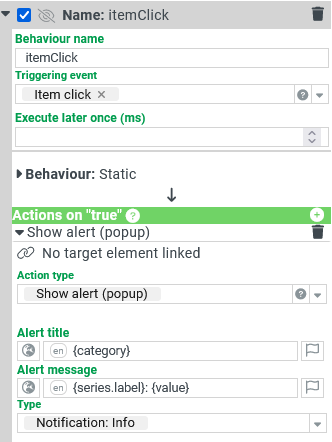
The data of a measured value can be processed further via the 'Item click' and 'Item double click' triggering behaviour. The object that is passed to the configured behaviour as input data is primarily a data provider, which contains all raw data sets that have been aggregated to the clicked value. Tip: With the action 'Show raw data of dashboard' this raw data can be displayed in a grid.
Furthermore, this object offers other data fields:
Data field | Description | ||||||||
|---|---|---|---|---|---|---|---|---|---|
value | The value that was clicked. | ||||||||
category | The value of the category. | ||||||||
categoryLabel | The category label. | ||||||||
series | The series configuration, which in turn contains the following data fields:
|
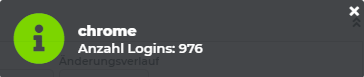
Example
|
Click on a series value. |
As configured in the behavior on the far left, the note shows 'category' as the title, and 'series.label' and 'value' as the message. |