Dynamic monitoring configuration
The runtime configuration interface lets you manage monitoring connections on-the-fly.
Accessing the configuration interface
Navigate to Administration → Monitoring:
.png)
Adding a monitoring platform
Click the plus icon in the bottom-right corner and complete the configuration form with your monitoring platform details:
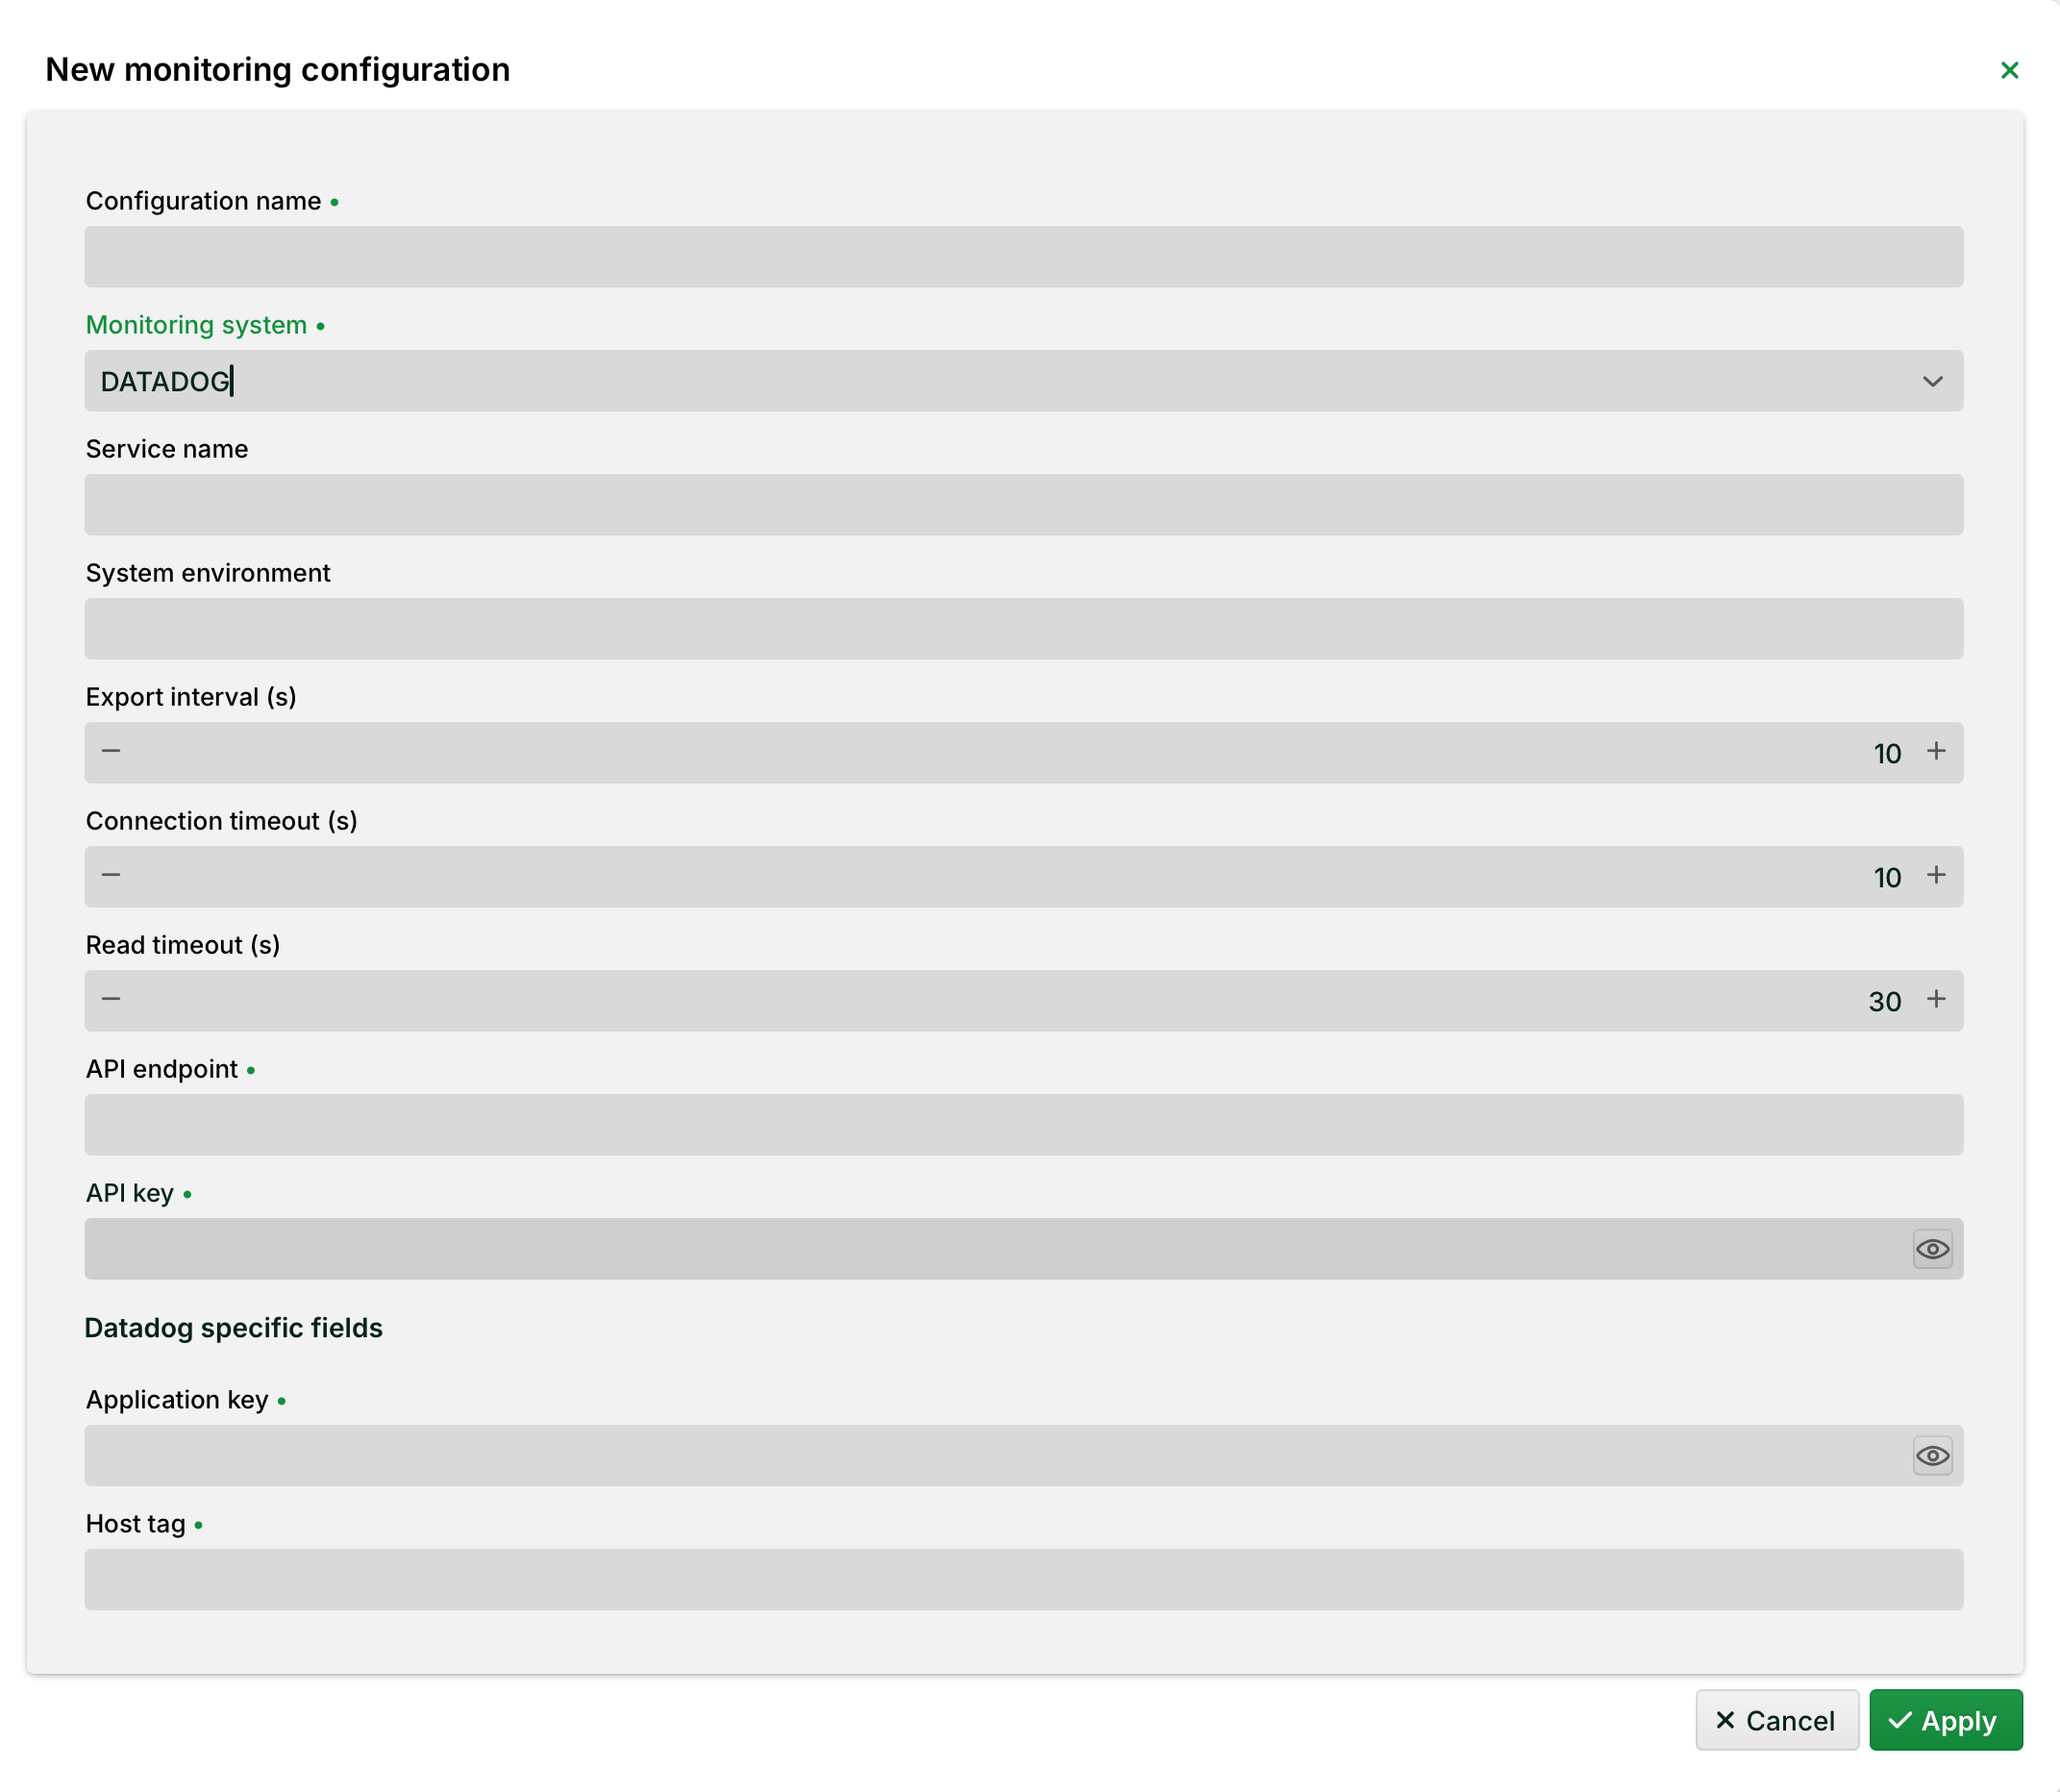
General fields
Configuration name (required): Unique name for the configuration.
Monitoring system (required): Target platform. Available options:
OTLP,DATADOG,PROMETHEUS.Service name/System environment: Optional labels used for filtering and dashboards on the target platform.
Export interval, Connection timeout, Read timeout: Time values in seconds (s). Defaults: 10 s/10 s/30 s.
API endpoint (required): URL of the target platform's metrics endpoint.
API key (required): Authentication token for the API endpoint.
Platform-specific fields
Depending on the selected Monitoring system, additional fields are displayed:
DATADOG: Application key (required) and Host tag (required).
PROMETHEUS: Prometheus token – generated automatically when the configuration is created.
WARNING The Prometheus token is only visible during creation. Copy it immediately and store it in a secure location – it cannot be retrieved later.
Click Apply to activate the new monitoring configuration. Metrics will begin flowing to your monitoring platform within seconds.
Managing configurations
Add/Edit: Modify any configuration and save. The connection restarts automatically with the new settings.
Delete: Remove a configuration to stop exporting to that platform.
NOTE All changes take effect immediately without requiring an application restart or affecting other active configurations.
Platform-specific setup examples
The following examples show how to populate the configuration form for popular monitoring platforms.
Service name and System environment are free-text labels you choose. They appear as filter attributes in your dashboards and are not validated by LDP. There is no fixed required value; pick something meaningful for your installation.
Grafana Cloud (OTLP)
When you set up an OTLP data source in Grafana Cloud, you receive three pieces of information: an endpoint URL, a numeric Instance ID, and a token. The Instance ID is not entered as a separate field in Lobster, the authentication is handled entirely through the API key field.
NOTE Recommended: use a Grafana Cloud Access Policy Token. In your Grafana Cloud portal, go to Home → Administration → Access Policies, create a new policy with the metrics:write scope, and generate a token. This token is used directly as the API key and removes the need to handle the Instance ID separately.
Lobster field | Value |
|---|---|
Monitoring system |
|
API endpoint | Find your exact URL in Grafana Cloud under Connections → Add new connection → OpenTelemetry. |
API key | Your Grafana Cloud Access Policy Token (recommended). |
Service name | A label identifying this Lobster installation, e.g., |
System environment | A label for the deployment stage, e.g., |
Export interval |
|
Connection timeout |
|
Read timeout |
|
New Relic (OTLP)
New Relic accepts metrics via a standard OTLP endpoint. Use your New Relic License key (Ingest – License type) as the API key. No Instance ID or additional credential encoding is required.
Lobster field | Value |
|---|---|
Monitoring system |
|
API endpoint | EU region: |
API key | Your New Relic License Key (found under Account Settings → API Keys, type: Ingest – License). |
Service name | E.g. |
System environment | E.g. |
Export interval |
|
Connection timeout |
|
Read timeout |
|