A radar chart (also polar or network chart) draws one axis per category in a star shape around the center point. Several measures (series) are marked with different colors, as in the other charts.
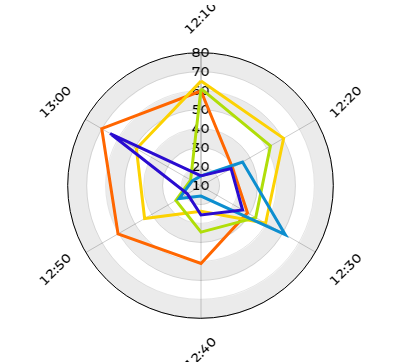
A 3D view does not exist for radar graphs. The option 'Fill alpha' fills the area of the graph into the inside.
Processing input data
The data of a measured value can be processed further via the triggering behavior 'Item click' and 'Item double click'.The object that is passed to the configured behaviour as input data is primarily a data provider that contains all the raw data sets that have been aggregated to the clicked value. Tip: With the action 'Show raw data of dashboard', this raw data can be displayed in a grid.
Furthermore, this object offers other data fields:
Data field | Description | ||||||||
|---|---|---|---|---|---|---|---|---|---|
value | The value that was clicked. | ||||||||
category | The value of the category. | ||||||||
categoryLabel | The category label. | ||||||||
series | The series configuration, which in turn contains the following data fields:
|
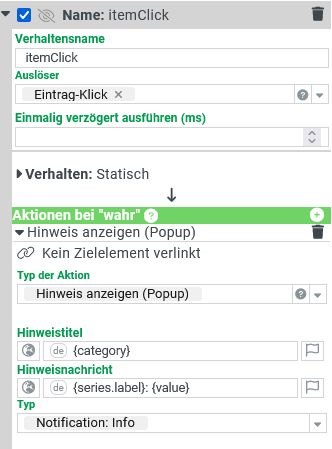
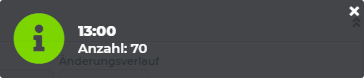
Example
|
As configured in the behavior on the far left, the note shows 'category' as the title, and 'series.label' and 'value' as the message. |